Chapter IV · Financials

Profitable today.
Built to compound.

A decade of real revenue and rising margins, not a promise. The numbers that follow are audited actuals through 2025, then management guidance to 2030.

01Track record → a decade of revenue growth and expanding profitability.
02Guidance → the path to €11M revenue and a 43.7% EBITDA margin by 2030.
03Balance sheet → a simple, well-capitalised structure with one convertible.

Financials · 01

A decade of product-revenue growth

Product revenue (€ thousand)
7.4% CAGR (EUR) — 9.9% CAGR (ISK)
1.431
1.531
1.786
1.445
1.788
2.152
2.343
2.446
2.543
201720182019202020212022202320242025
Reported EBITDA as a % of product revenue has been on a strong upward trajectory since 2022. Klappir’s cost structure is simple, with the majority of costs being salaries.
As is accustom in tech companies and in accordance with IFRS, Klappir capitalizes a portion of salaries as intangible software assets that are later amortized. For information on capitalization, refer to page 29.
Low customer acquisition costs through the flywheel distribution model, advances in artificial intelligence and its adoption into operations, result in high operating leverage and primes the company for profitable growth.

Financials · 02

Growing profitability

Reported EBITDA (€ thousand) & margin
Margin 27.1% → 43.3% · 2021 → 2025
48527.1%
22110.3%
65227.8%
99440.6%
1.10143.3%
20212022202320242025
Reported EBITDA as a % of product revenue has been on a strong upward trajectory since 2022. Klappir’s cost structure is simple, with the majority of costs being salaries.
As is accustom in tech companies and in accordance with IFRS, Klappir capitalizes a portion of salaries as intangible software assets that are later amortized. For information on capitalization, refer to page 29.
Low customer acquisition costs through the flywheel distribution model, advances in artificial intelligence and its adoption into operations, result in high operating leverage and primes the company for profitable growth.

Financials · 03

CAPEX driven by capitalized R&D costs

Capitalized costs and total CAPEX, EURk, by year
Klappir has since 2017 qualified and been awarded a grant from Rannís. The role of the Technology Development Fund is to support development and research in the field of technology aimed at innovation in the Icelandic economy.
While there has been uncertainties surrounding Rannís recently, Klappir’s application for a grant in 2025 has been approved. The grant is recorded in Klappir’s accounts as an offset to the corresponding year’s capitalized R&D costs.
Minimal investments are otherwise required to maintain Klappir’s asset base, they are limited to computers and furniture as the company rents its premises and thus the capital intensity required is low.
Annual accounts 2017-2023 have been amended to align with the 2024 and 2025 account after the company took up IFRS. Previously, grants were recognized as other revenue. After IFRS, the grants are recognized as reduction of capitalized R&D costs.

Financials · 04

Guidance to 2030

€11.0M
Product revenue · 2030E
from €2.744M in 2026E
43.7%
Reported EBITDA margin · 2030E
€4.805M EBITDA · 19.1% net of capitalization
€2.7M
CAPEX · 2030E
net capitalized R&D + fixed assets
Revenue guidance (€ thousand)
1.788
2.152
2.343
2.446
2.543
2.744
11.002
202120222023202420252026E2030E
Penetration of new international markets, and the application of the flywheel distribution model are the foundation Klappir expects to build its growth upon. With AI layered on top of the system, customers will find wins easily, increasing retention and ACV for Klappir
With accelerated revenue growth and the high operating leverage enabled by the distribution model and AI advancements, reported EBITDA margin is projected to expand to 43.7% by 2030. Net of capitalization the EBITDA margin is projected to be 19.1%.
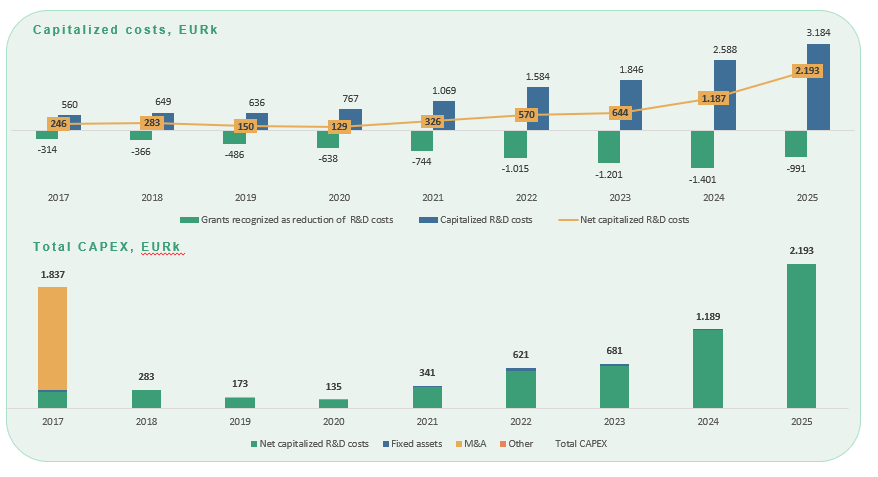
From 2026-2030, investments in business development efforts to realize the growth plan are expected. These costs are often not eligible for capitalization. Capitalization as a % of revenue is thus expected lower, reflecting a shift from a building phase to the growth phase. No grants are included in the forecast.

Financials · 05

Balance sheet: 31.12.2025

Assets (EUR ’000)
Intangible assets4.554
Property and equipment324
Security deposit10
Deferred income tax155
Non-current assets5.043
Trade receivables63
Other receivables1.064
Cash and cash equivalents994
Current assets2.121
Total assets7.163
Equity & liabilities (EUR ’000)
Share capital499
Other restricted shares4.437
Retained earnings(1.651)
Total equity3.285
Non-current loans2.404
Liabilities to related parties298
Lease liabilities213
Non-current liabilities2.915
Current maturities of lease liabilities129
Trade payables185
Other payables350
Deferred revenue298
Current liabilities963
Total liabilities3.878
Total equity & liabilities7.163

Convertible bond

  • Klappir maintains a simple capital structure with only one debt instrument outstanding. The €2.4m NEFCO convertible aligns long-term stakeholders with the company’s growth strategy.
  • Potential future conversion would deleverage the balance sheet and increase equity capitalization.
  • NEFCO has indicated a willingness to convert to B-shares once Klappir’s listing on the Nasdaq First North market in Sweden is completed.
Debt to Equity ratio 1.18x
Capital structure
54%
Debt
3.8 mEUR
46%
Equity
3.3 mEUR
Assets
7.2 mEUR

The detailed model is in the data room.

Audited actuals, guidance assumptions and the cap table are available on request.

Request more data