Confidential
Investor presentation · 2026

KLAPPIR

Executive Summary
THE PROJECT

Building the data
infrastructure for
resource efficiency

Klappir builds the data infrastructure that helps organisations collect, structure and use data with accuracy and confidence. The software transforms complex data into accountable insights, reducing waste of resources, realising stronger savings and ensuring full regulatory compliance

01
The need
Organisations need better data to be competitive
02
The gap
Resource data is difficult to collect and hard to manage, but highly valuable
03
The answer
Klappir solves this problem with high quality data flow and enhancements → and turns data into outcomes
I
CHAPTER I
Klappir today
II
CHAPTER II
The market
III
CHAPTER III
The future of Klappir
IV
CHAPTER IV
Financials
V
CHAPTER V
Summary

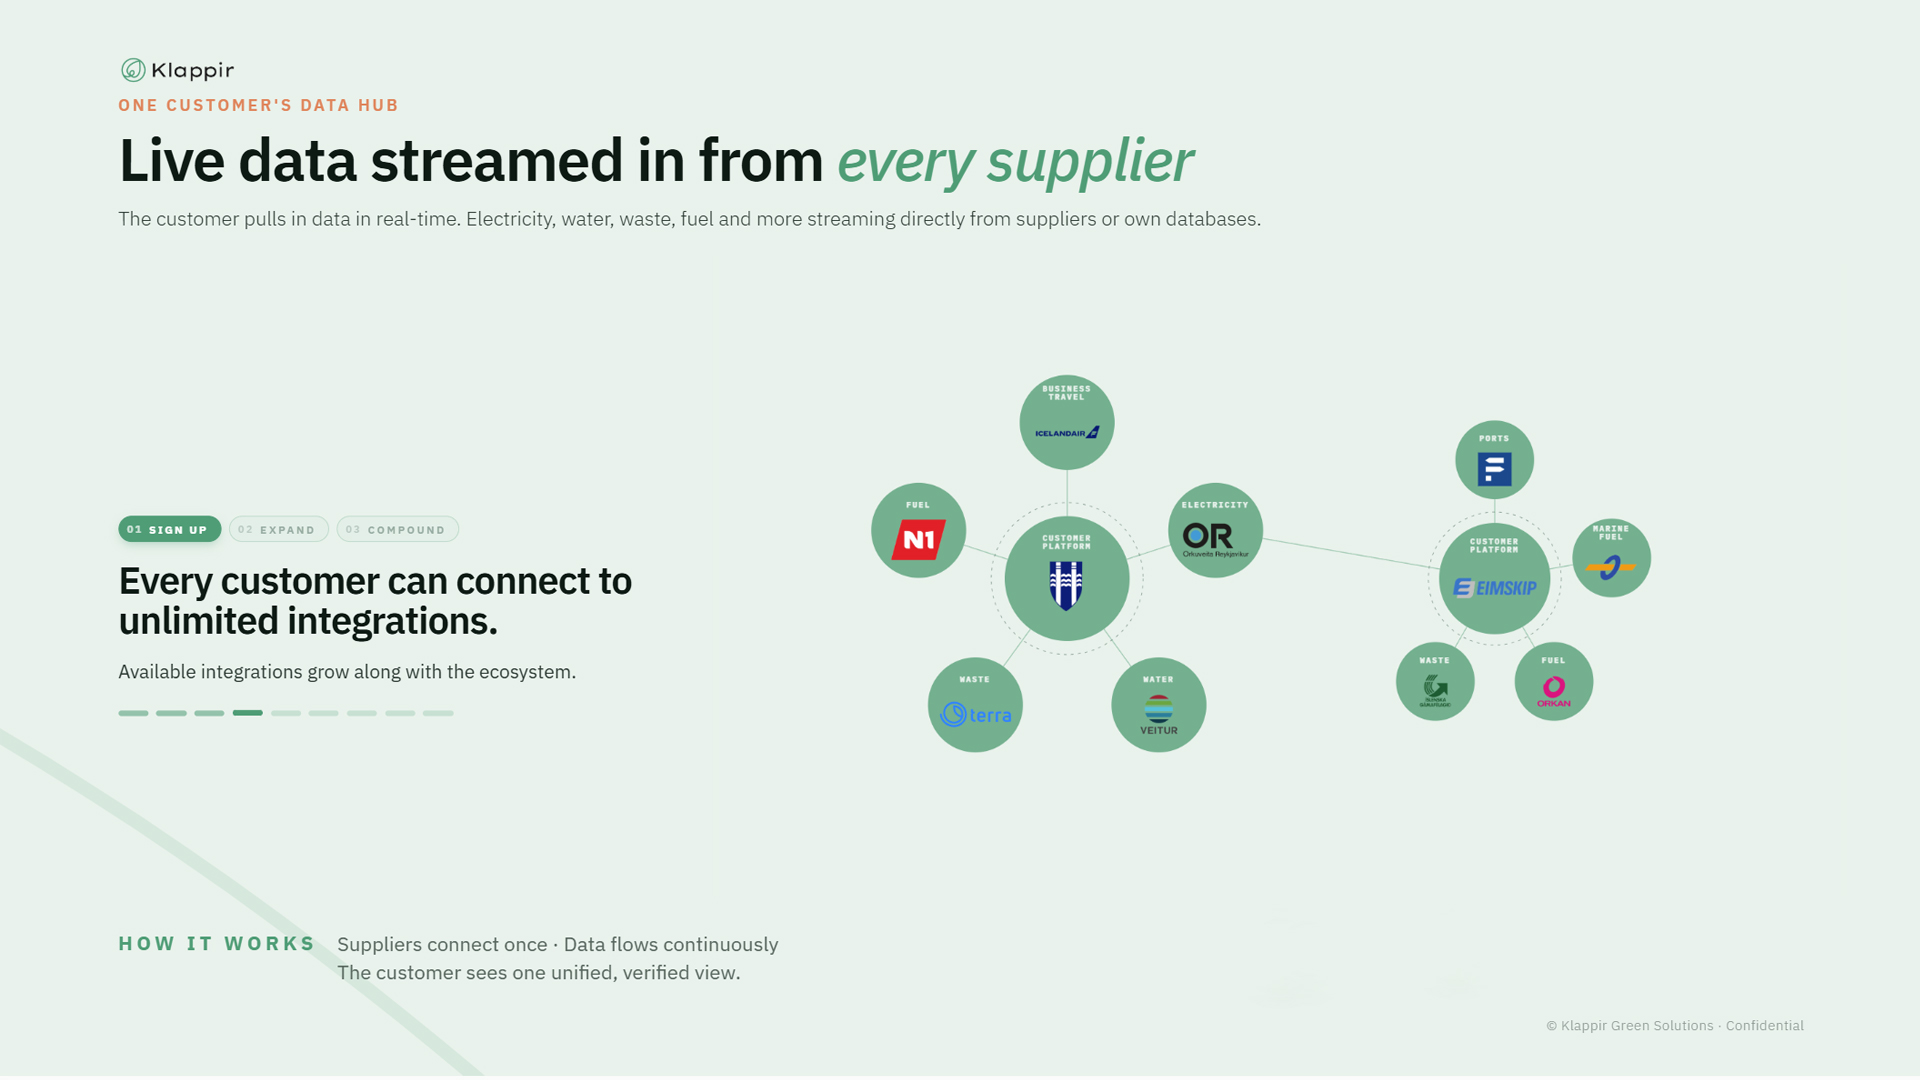
Built on a strong scalable foundation, Klappir is extending global reach of its data infrastructure. By introducing AI functions and flywheel distribution Klappir will accelerate its growth and impact greatly. 

I

Klappir today

What we do and how we do it

Klappir at a glance

The data infrastructure for operations & sustainability

Organisations come to Klappir for the best resource data available in the highest automation possible. The data they collect is used to optimise operations and share information they trust with their stakeholders.

01 · The product
Product built for trust and excellence.
We unify scattered, complicated data on energy, water, waste, fuel and transport into one enhanced data structure.
Less manual work, fewer errors, decisions customers can trust.
02 · The distribution
Customer-driven distribution
Customers invite their stakeholders to share data for free. Freemium users upgrade to paid subscriptions for more data and more opportunities.
Distribution compounds with the network, and CAC trends toward zero.
03 · The team
Hardened team of data experts
Expertise in resources and sustainability, paired with engineers and operators who've shipped software at scale across product, success and international expansion.
Domain depth + tech discipline, in the same room.
THE SOFTWARE CATEGORY
Data Infrastructure
Setting the industry standard for how resource data is structured, used and exchanged.
Key figures
>96%
Recurring revenue
>22%
EBIT margin
800+
Ecosystem installations
30+
Countries
History of Klappir

More than a decade of growth, innovation & proven results

Klappir is built on a robust, scalable infrastructure and validated by strong market references, positioning the company for accelerated and capital-efficient growth in international markets.

2014
Founded
Maritime focus - first integrations, record books digitised.
2015
Platform
First platform interface launched.
2017
Listed
Nasdaq First North Iceland.
2019
SaaS focus
Decision on pure  software services
2020
Klappir Nordic
Entered Danish market.
2025
Ready to scale
Infrastructure-grade
Flywheel launched.
2026
Global deployment
Scaling: funding & listing in Sweden.
The 2019–2025 strategy transitioned Klappir from a hybrid operating model into a scalable, platform-centric company.
€1.4m €2.5m
1.4 2017 1.5 2018 1.8 2019 1.4 2020 1.8 2021 2.2 2022 2.3 2023 2.4 2024 2.5 2025
~7.4% CAGR
    2017 → 2025
62% → 96%
Recurring revenue · cycle
0% → 32%
Freemium share · 2025 → 2026
2026–2030 · SCALING PHASE
Implementation of further international expansion from 2026, while maintaining platform consistency and operational efficiency across markets.
→ Funding round & Sweden listing unlock the next decade.
Leaders and board of directors

Operators that have done it before

Klappir's team brings deep expertise in sustainability, technology, and international growth, the operating foundation for continued product development and scalable expansion.

Executive Management
Þorsteinn Svanur Jónsson
CEO & Co-founder
Íris Karlsdóttir
Íris Karlsdóttir
CBDO
Hulda Þórhallsdóttir
CCO
Sigrún Hildur Jónsdóttir
CPO
Kristján Hall
Kristján Hall
CTO
Ólöf Ásta Ólafsdóttir
CFO
Board of Directors
Ágúst Einarsson
Ágúst Einarsson
Chairman of the board
Jón Ágúst Þorsteinsson
Board member & Co-founder
Vilborg Einarsdóttir
Board member
Sverrir Sverrisson
Sverrir Sverrisson
Board member
Áslaug Eva Björnsdóttir
Board member
Sigrún Hildur Jónsdóttir
Alternate board member · Co-founder
One customer's data hub

Live data streamed in from every supplier

The customer pulls in data in real-time. Electricity, water, waste, fuel and more streaming directly from suppliers or own databases.

01Sign up 02Expand 03Compound

It starts with a sign-up into the Platform.

In the beginning the new organisation operates in a silo — data can be imported, asset models configured, reports generated and resource consumption analysed.

How it works Suppliers connect once · Data flows continuously
The customer sees one unified, verified view.
What we offer

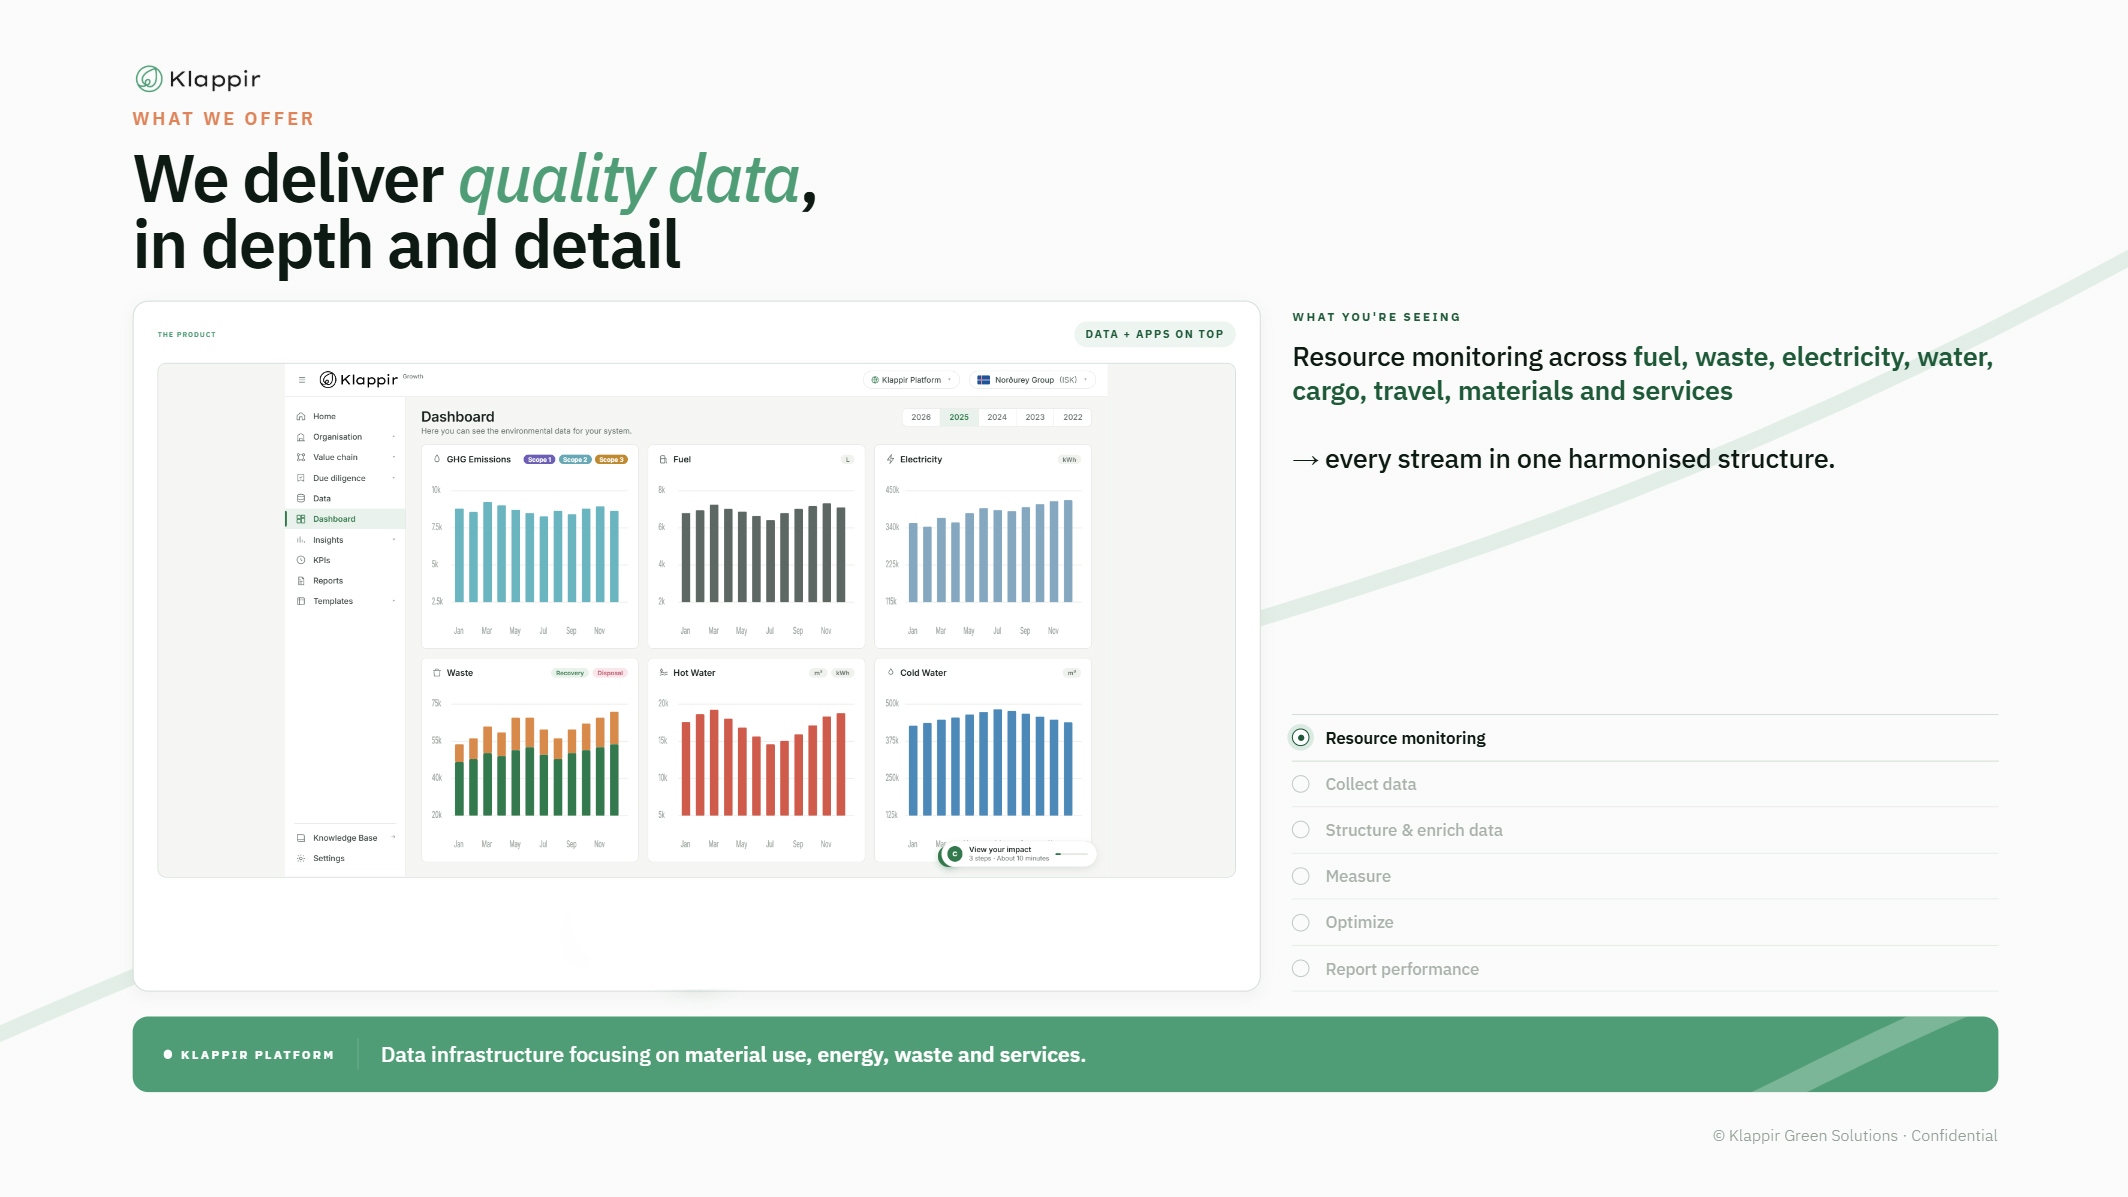
We deliver quality data,
in depth and detail

The product
Data + apps on top
Klappir Platform — statutory reports
What you're seeing
Resource monitoring across fuel, waste, electricity, water, cargo, travel, materials and services

→ every stream in one harmonised structure.
  • Resource monitoring
  • Collect data
  • Structure & enrich data
  • Measure
  • Optimise
  • Report performance
Klappir Platform Data infrastructure focusing on material use, energy, waste and services.
Customers

Built on the operations of leading enterprises

800+ installations
30+ countries
IKEA
Icelandair
Toyota
Rio Tinto
Eimskip
Reykjavík
Icelandic Coast Guard
66°North
Síminn
Ölgerðin
Blue Lagoon
Íslandsbanki
Kópavogsbær
Kerecis
Brimborg
ÞG Verk
Asetek
Reykjanesbær
Hagar
Sybo
Dilling
Aasted
The Whole Company
Fayard
Andersen & Heegaard
Polar Seafood
Adina
Kurhotel Skodsborg
Brøchner Hotels
Guldsmeden Hotels
Sinatur
C.W. Obel
Brønnum
Nic. Christiansen Gruppen
Capital Investment
Semco Maritime
Forenede
Give Steel
MS Byg
ARO
Orla Brasil
…and many more
Operations across Industrial · Public sector · Retail · Hospitality · Maritime · Construction · Aviation · Food
Problem & Solution

Solving the complex data challenge, all on one platform

Companies cannot manage what they cannot measure reliably. The unified platform replaces chaotic spreadsheets and disconnected databases with structured, real-time data for enterprises.

01 · The problem

Disconnected data & growing pressure.

Scattered data
Electricity, water, waste, fuel, goods and services data sit in disconnected systems with different formats and quality.
Trust & verification issues
Companies can't share data confidently; it's hard to trace back to its source and risk of brand damage increases.
Mismanaged resource use
Lack of good data causes most companies to mismanage and waste resources.
Dependence on experts
Inefficient data leads to dependence on specialists to collect, understand and report on sustainability performance.
02 · The solution

A platform that streamlines fragmented data.

Data aggregation & structure
Collects from all sources and structures into a uniform model, enabling reliable, comparable monitoring and reporting.
Automated reporting
Automates calculations and generates reports derived from huge quantities of tamper-proof data.
Highly reliable monitoring
Real-time visibility across all resource streams enables continuous optimisation and measurable reduction in waste.
Independence & empowerment
The platform puts data collection, analysis and reporting directly in the hands of your own team, reducing cost, dependency and delay.
End-to-end  ·  Data → Impact

Transforming scattered data into actionable outcomes

Klappir powers the entire resource data journey (sourcing, processing and delivering trusted insights) on one unified infrastructure that drives transparency, compliance and sustainable business impact.

01 · Data sourcing

The Foundation

Collecting data from all sources into one structured foundation.

Energy & utilities Goods & services Asset models Value-chain model Internal systems Coefficients
02 · Data processing

The Engine

Turning raw data into reliable, standardised building blocks.

Error corrections Standardisation Data enrichment Calculations & conversions Perpetual storage Mapping rules
03 · Outcomes

The Impact

Delivering insights that drive decision making and value.

Resource monitoring Impact monitoring Reports Share data Due diligence
The outcome: Transparent, investor-grade information that enables true resource efficiency and satisfies evolving global regulations, de-risks corporate value chains, and unlocks access to a more competitive position.
II

The Market

Resource costs and regulation are rising across Europe, making resource data essential rather than optional.

The cost of resources

Costs are increasing across the board

Prices for energy, water, waste, carbon and materials are rising in lockstep across Europe, and public policy accelerates the increase through 2032.

+1,087% EU ETS carbon allowance, 2010 → 2032
+286% EU landfill tax, weighted average
+106% EU combined water tariff
+100% EU household electricity
+78% EU retail diesel (Brent flat)
+93% EU construction cost index
Index · 2010 = 100 · nominal

Resource costs across Europe, 2010 → 2032

Actuals 2010–2026 · Forecast 2027–2032
0 100 200 300 400 500+ 2010 = 100 FORECAST → 2010 2015 2020 2025 2030 2026 → +1,087% EU landfill tax · +286% EU water · +106% EU electricity · +100% EU construction · +93% EU diesel · +78% Brent crude · –2% Baltic Dry Index · –38% commodity outliers (not what consumers pay)
Sources · Eurostat nrg_pc_204/205 · EC Weekly Oil Bulletin · Eurostat sts_copi · ICE/EEX (EUA) · Member-State landfill schedules · IEA WEO STEPS · Baltic Exchange Forecast layers ETS2 · CBAM · UWWTD · landfill escalators
The trust gap

Stakeholders are demanding data

Customers, consumers, authorities and investors are all asking the same question 

01 · Customers
1.4×

Faster sales growth for products with verified sustainability claims — 28% vs 20% cumulative (2017–2022).

NielsenIQ & McKinsey, 2023
02 · Consumers
64%

Perceive greenwashing. Only 22% trust claims without verification.

Capgemini · Deloitte
03 · Authorities
84%

Agree EU environmental legislation is necessary to protect the environment — the mandate behind CSRD, CBAM & ETS2.

Special Eurobarometer · Environment, 2024
04 · Investors
83%

Of companies struggle to access accurate emissions data.

GHG Protocol · EcoVadis 2025
What every stakeholder is really asking for
Reports Audits Raw data Certificates Verifications
BASED ON PROJECTED MARKET TRENDS, A MID-CAP INDUSTRIAL COMPANY COULD SAVE 20% IN OPEX COST USING KLAPPIR

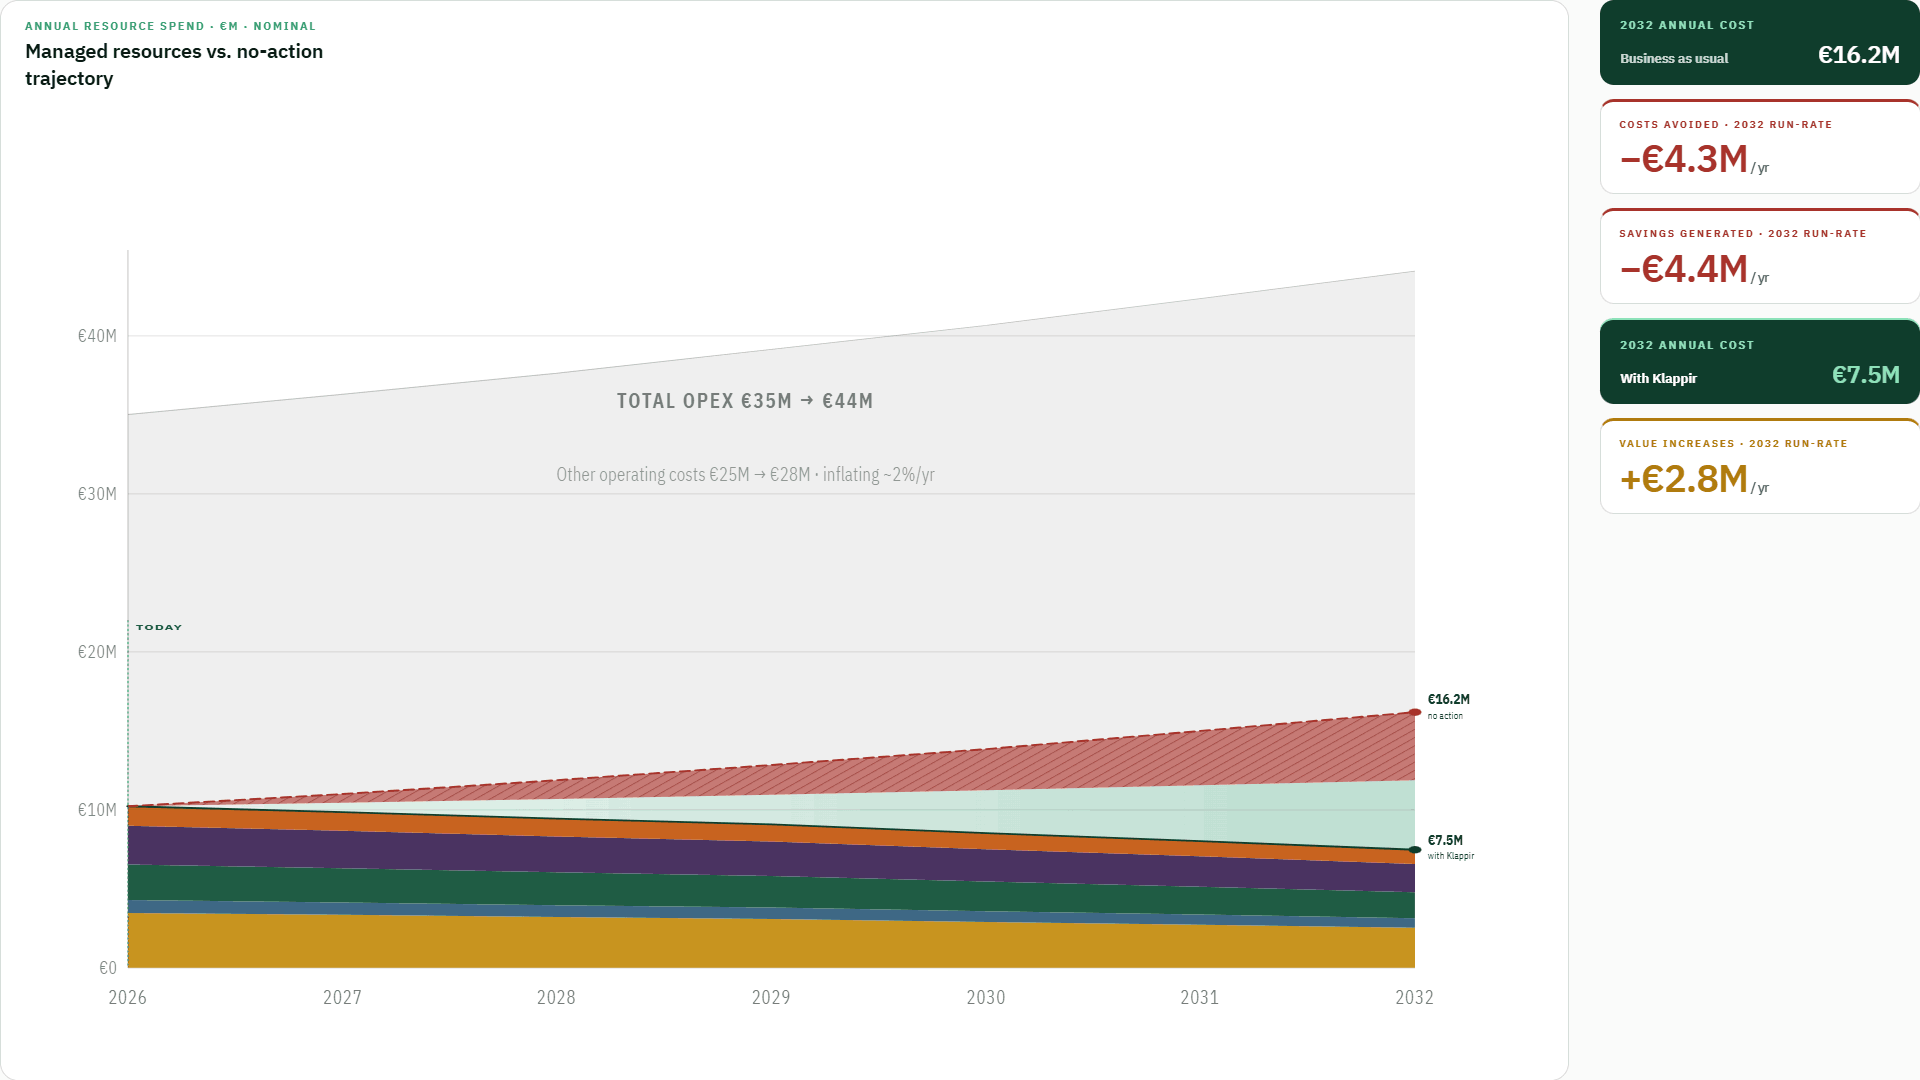
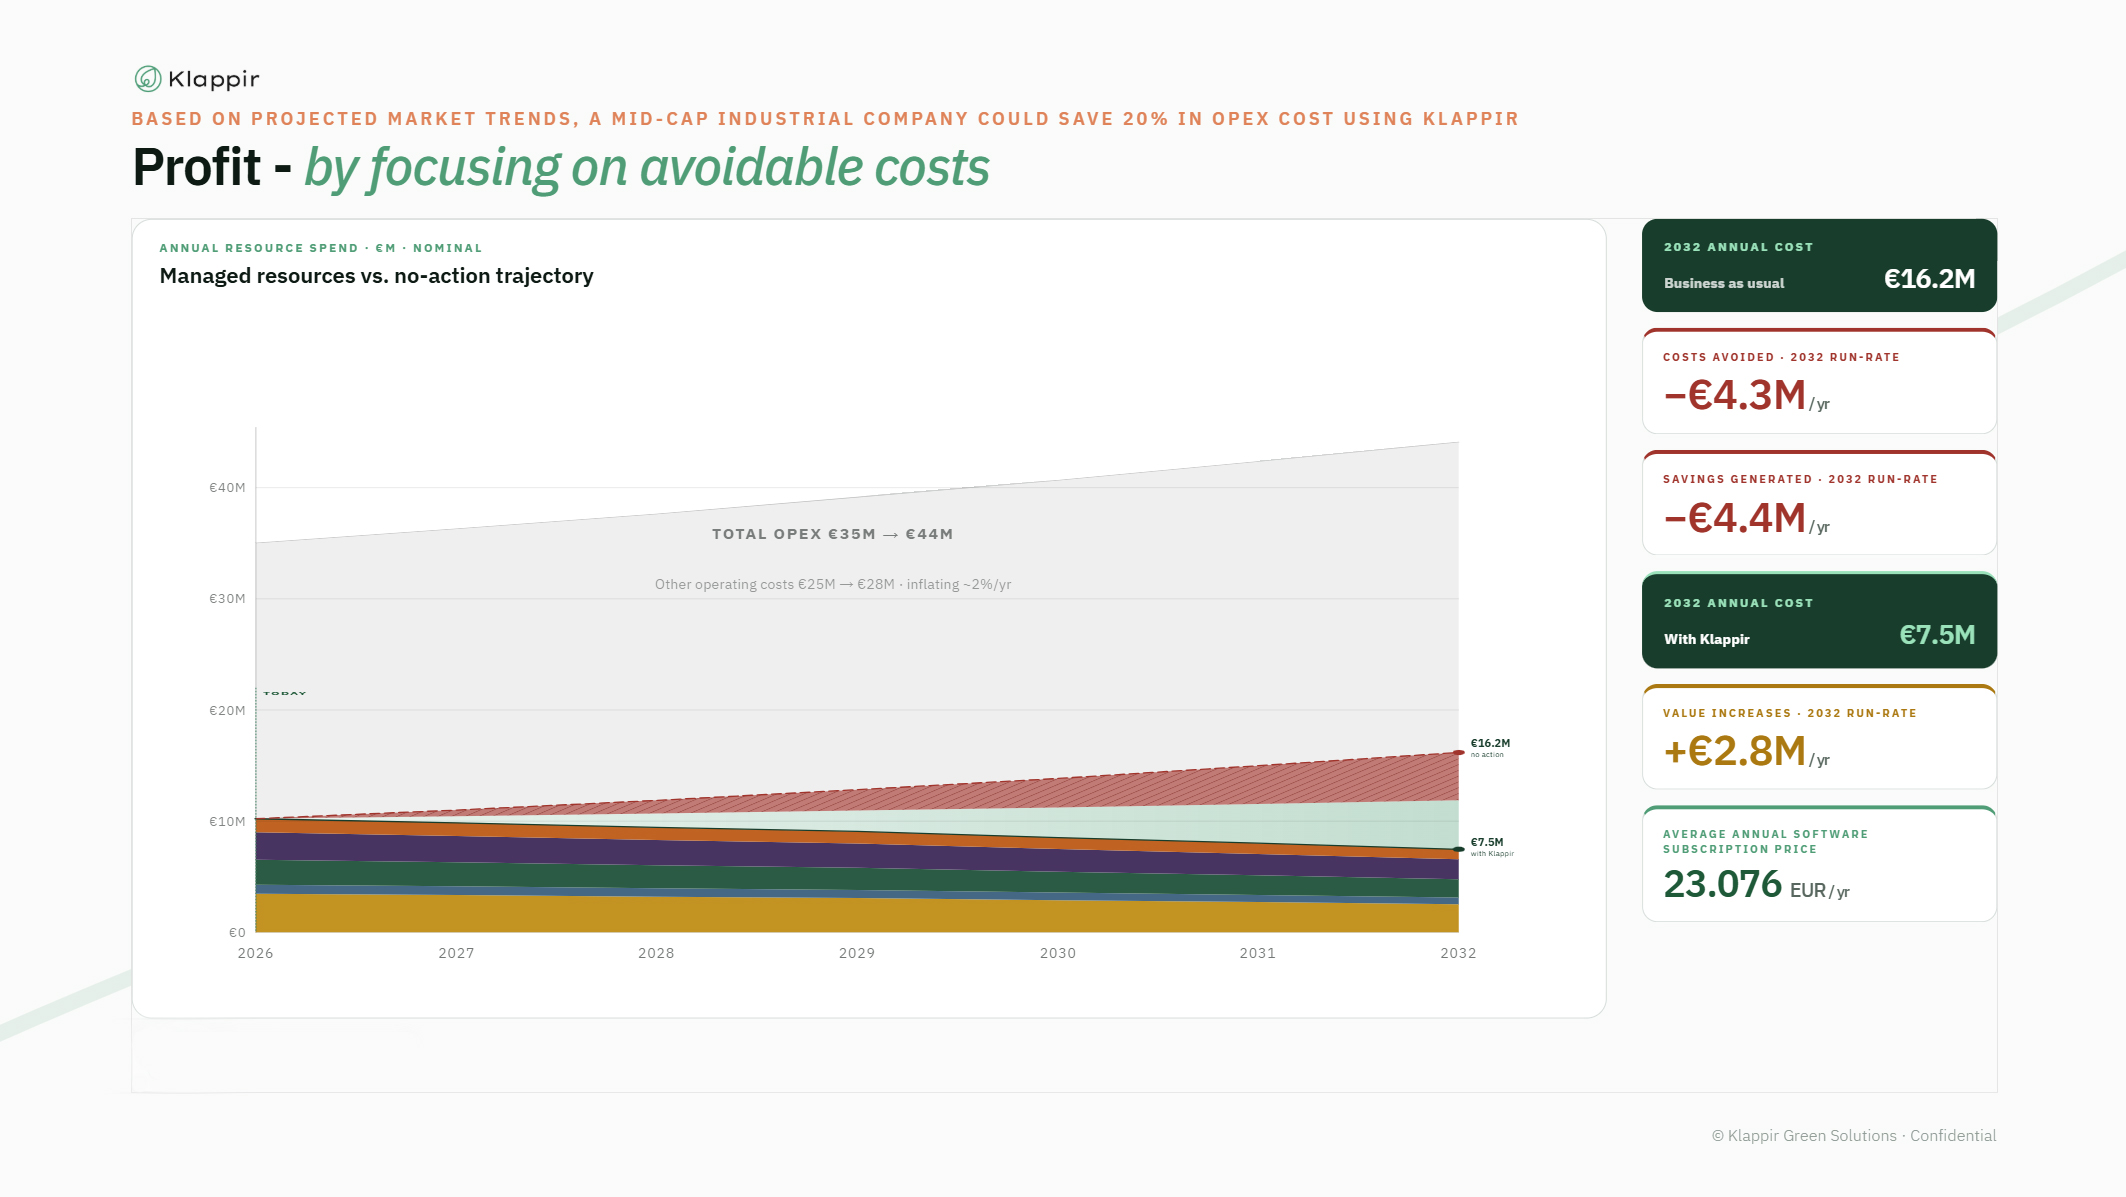
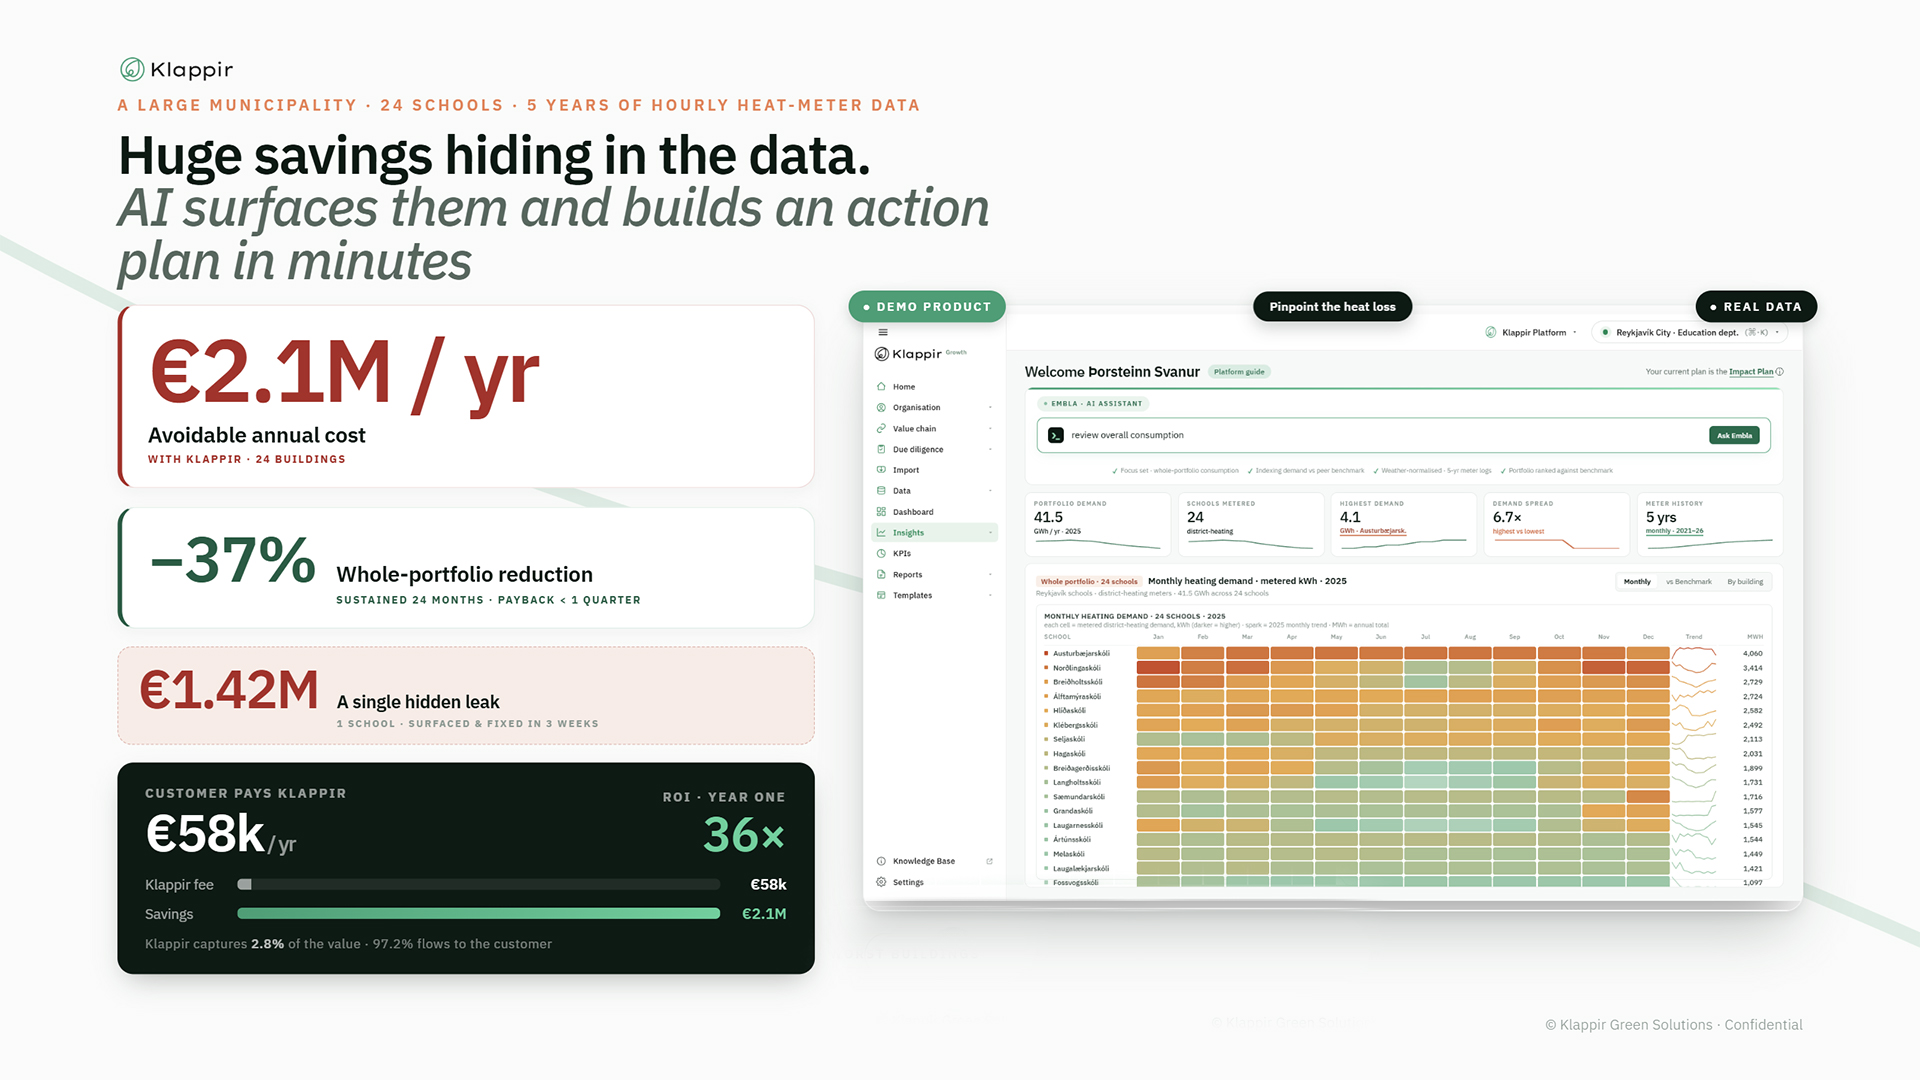
Profit - by focusing on avoidable costs

Opportunity quantified — final chart
Voices from the field

Customers see it too: in cost, in carbon, in time

Real numbers from operators across construction, shipping, retail, hotels, beverages & the public sector.

−20%
cost per kilo of waste, YoY
57 → 83% sorting · 33 → 77% recycling

“A complete game changer. We publish our waste ratio at the top of our website.”

Bergur Helgason · Quality Manager
−23.5%
CO₂e per ton of cargo transported
Real-time KPI monitoring

“Real-time monitoring exposes environmental impact and the non-financial factors in our value chain.”

Eyþór H. Ólafsson · Eimskip
200 hrs+
saved on the first DMA process
DKK 300,000 saved

“Foundational for our first DMA, saved valuable time and eliminated the need for external advisors.”

Rasmus Jørgensen · Head of ESG
SBTi approved
emission targets validated by Science Based Targets initiative
Scope 1 & 2 automated

“Klappir’s data connections save time during statement periods, a key factor in getting targets approved.”

Thora Rut Jonsdottir · Dir. of Sustainability
2019
carbon-neutral operations since
2040 target · loans & investments

“Better data, measurements and comparisons. We set the goal higher every year.”

Kristrún Tinna Gunnarsdóttir · Head of Strategy & Sustainability
Real-time across stores
energy & waste data direct from service providers
YoY improvement across measures

“The platform collects real-time data and calculates the carbon footprint of the operation.”

Jón Þórir Þorvaldsson · ESG Lead
-€1.42M saved
emissions tracking across the municipality
5 years of hourly heat-meter data

A single hidden leak, that surfaced during Klappir’s data processing, was fixed in 3 weeks which saved the municipality over one million euros.

Based on data from the Klappir Platform
Since 2018
NASDAQ ESG guidelines, published
Measurable waste reduction

“The basis for us to set measurable goals when it comes to reducing waste.”
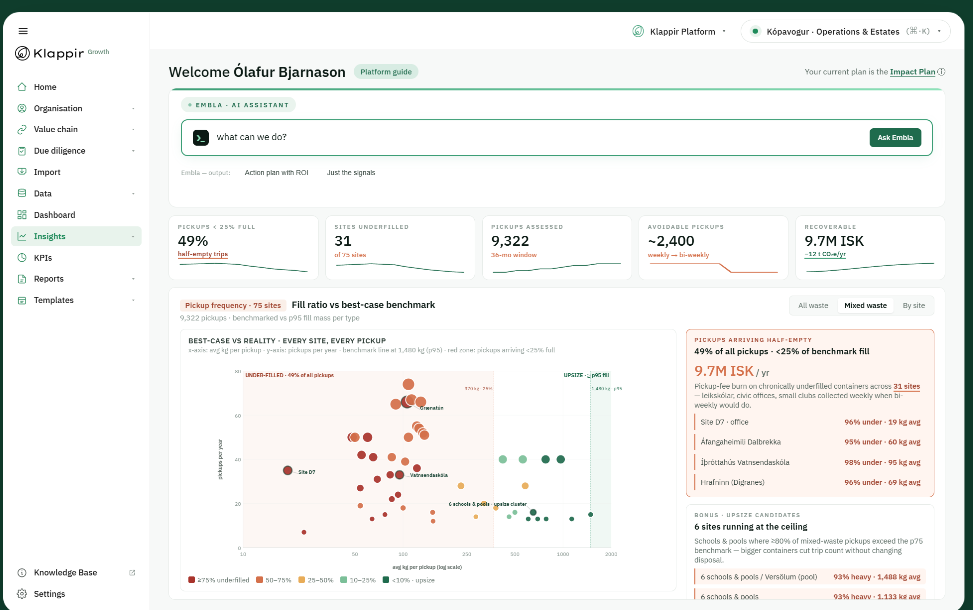
Guðrún Eva Gunnarsdóttir · CFO
Competitive advantage

Securing market leadership through three structural advantages

Competitors cannot easily steal market share because Klappir is protected by deep software integration, an interconnected supplier network, and pre-approved data trust, advantages that take years to build from scratch.

01 · Replacement
Connection to customers.
Deeply connected
Data integrations made, data enhanced and stored, digital models built and it's auditability over time builds stickiness.
Painful to rip out
Replacing Klappir means breaking every data connection and starting over.
High customer loyalty
Once a company plugs into Klappir, they stay.
02 · Replication
Network of customers.
Connected ecosystem
Large number of suppliers and businesses are already linked to Klappir.
Interconnected data sharing
When a supplier connects, its data instantly auto-populates for dozens of corporate buyers.
Uncopiable ecosystem value
A competitor's product has zero connected network data on day one.
03 · Rebuilding
Deep trust in the data.
Trusted data
The data acts as a secure ledger that cannot be tampered with.
Instant approval
Auditors already trust Klappir's formats, saving customers months of manual verification.
Massive time barrier
Rebuilding equivalent models takes years of configuration.
The compounding moat
Competitors cannot easily displace Klappir because the value grows with every new connection. Klappir continuously extends it's data capabilities, enhancing existing data with the latest scientific knowledge, technology and outcomes. The ability to mass-produce data-sharing capabilities through strict harmonised channels is a feat hard to replicate.
III

The future of Klappir

How Klappir will evolve over the next five years

The future of Klappir

AI will supercharge efficiency

With data in good detail and quality, AI can spot big opportunities and suggest an action plan in a fraction of a time a capable specialist can.

01 The foundation
Data.

High-volume data on energy, water, waste, cargo, travel, gas, fuel and more.

The core foundation of the Klappir platform: 130+ source systems harmonised the moment data arrives.

02 The opportunity
AI.

Understood and explained in minutes.

AI inside the Klappir platform unlocks significant possibilities for every customer.

03 The result
Outcomes.

Operational efficiency for every user, regardless of expertise.

Global knowledge and computing power, unleashed on each customer's unique data.

Embla · your data in plain language

Ask it anything.
Get clear directions

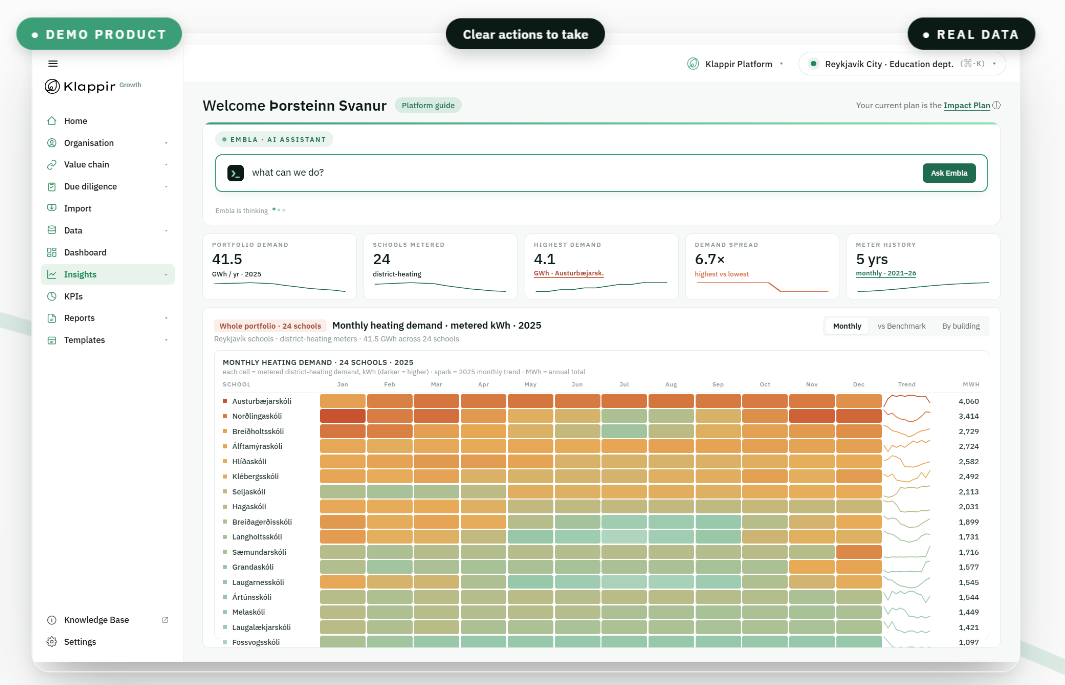
A data feed detailed enough to optimise every kilo, kilowatt, and cubic metre.

TWO WAYS CUSTOMERS USE THE DATA
1
Run it all on the Klappir Platform
They operate entirely on Klappir with Embla as their agent, a junior analyst works at CSO level, and expansion revenue grows without adding seats.
2
Stream data into own database and own agent
Large enterprises run their own warehouses and AI agents, drawing on Klappir as the utility-grade source layer underneath. We are their supplier, not their app.
Ask any questions
Demo product
Real data
Klappir Waste — half-empty pickup analysis
99%
Time to outcome
Any role
No expertise needed
€0
Training cost
Stage 01 · Start
A large municipality · 24 schools · 5 years of hourly heat-meter data

Huge savings hiding in the data.
AI surfaces them and builds an action plan in minutes

€2.1M / yr
Avoidable annual cost
WITH KLAPPIR · 24 BUILDINGS
−37%
Whole-portfolio reduction
Sustained 24 months · payback < 1 quarter
€1.42M
A single hidden leak
1 school · surfaced & fixed in 3 weeks
Customer pays Klappir
€58k / yr
ROI · year one
36×
Klappir fee
€58k
Savings
€2.1M
Klappir captures 2.8% of the value · 97.2% flows to the customer
Klappir Schools — heating demand by building
● Demo product
● Real data
Ask any questions
Stage 01 · Start
The Klappir distribution strategy

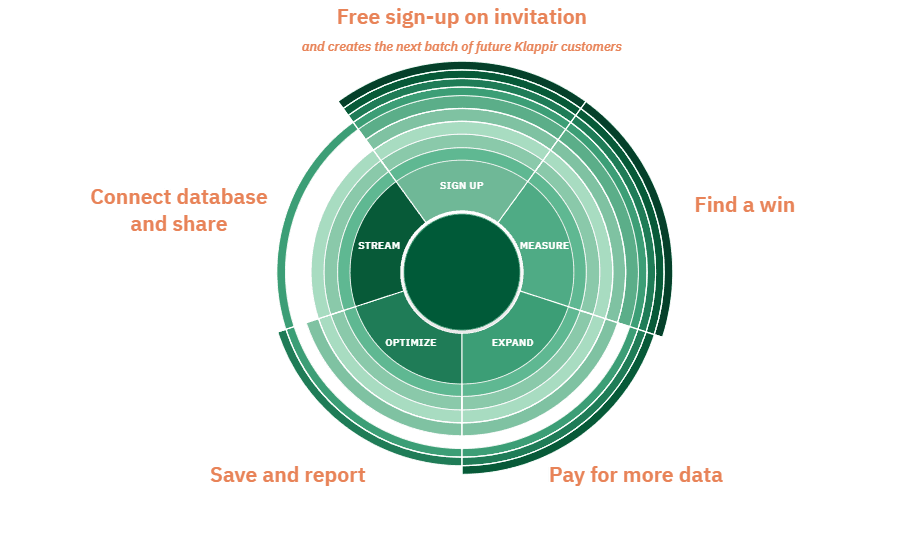
The Klappir flywheel distribution model

Klappir flywheel — full cycle
SIGN UP MEASURE EXPAND OPTIMISE STREAM OUR CUSTOMER Becomes the next hub every cycle invites the next Accept a supplier's invite Free entry · realtime data feed received Actively monitor the stream Live visibility into resource flows Pay to add more data sources First commercial step · more streams, more coverage Realise huge savings with AI AI agents act on the data → operational ROI Become a Klappir hub Invite your own customers · cycle restarts
Problem
Organisations need data from one another.
Solution
Klappir enables easy sharing of important data between organisations unlocking new margins.
Five stages, in spin order
1 Sign up - one data stream free.
2 Measure - surface the first saving in live data with help from Embla.
3 Expand - pay to add more data sources.
4 Optimise - Embla act continuously, savings compound.
5 Stream - share data, become the next hub ↻ loop restarts
Driving through existing value chains

Pillars of the go-to-market strategy

01

Geographical markets

Enter each market by lighting up its core data integrations first — utilities, ports, registries — so every local customer plugs into rails that already exist.

02

Partner‑focus

Grow through partners’ existing business networks — advisors, consultants, industry bodies — who introduce Klappir to customers they already serve.

03

Network effect

Every data integration serves all customers at once. Supply-side connections compound — the next customer in a market onboards with zero new pipework.

04

Instant wins in freemium

A free first data stream, then Embla surfaces a concrete saving in minutes — the instant win that turns a sign-up into a paying, expanding customer.

Oslo Stockholm Copenhagen Edinburgh London REYKJAVÍK · ORIGIN
Helsinki Amsterdam Berlin Dublin Oslo Stockholm Copenhagen Reykjavík London PRIORITY TARGET
IS NO SE DK UK UN · ISO · GRI · CSRD
Same classification. Every market. One platform.
ISO 14064GHG ProtocolCSRDTCFDGRIUN SDGs
Driving through existing value chains

Pillars of the go-to-market strategy

01Geographical markets

Enter each market by lighting up its core data integrations first — utilities, ports, registries — so every local customer plugs into rails that already exist.

02Network effect

Every data integration serves all customers at once. Supply-side connections compound — the next customer in a market onboards with zero new pipework.

03Partner‑focus

Grow through partners’ existing business networks — advisors, consultants, industry bodies — who introduce Klappir to customers they already serve.

04Instant wins in freemium

A free first data stream, then Embla surfaces a concrete saving in minutes — the instant win that turns a sign-up into a paying, expanding customer.

Integrations 0
Installations 0
● Network demo
The offering at a glance

Raising €8M · Growth round

Use of proceeds
Flywheel distribution

European expansion through the product-led supplier cascade; AI + data platform build-out; go-to-market in target geographies.

Advisor
Fossar

Fossar Fjárfestingabanki as sole bookrunner.

Timeline
Q2 2026

Launch in Q2 2026. Pricing and final terms in process.

IV

Financials

Profitable today, built to compound

Financials · 01

A decade of product-revenue growth

Product revenue (€ thousand)
EUR 7.4% CAGR (EUR) — 9.9% CAGR (ISK) 1.431 1.531 1.786 1.445 1.788 2.152 2.343 2.446 2.543 2017 2018 2019 2020 2021 2022 2023 2024 2025
Klappir’s product revenue has demonstrated a solid 7,4% CAGR since 2017, driven by the expansion of the company´s ecosystem, user base and product offerings, alongside external growth.
The pillars in Klappir´s growth is driven by a partner led go-to-market model, a strong local delivery network, and a platform centric approach powered by self serve onboarding. In product guidance, and usage-based expansion.
Note that the graph only illustrates product revenue and from 2017-2023 the ISK result have been translated to EUR using the average EUR/ISK FX rate of the corresponding year. In ISK terms the CAGR over the period is a strong 9,9%.
Financials · 02

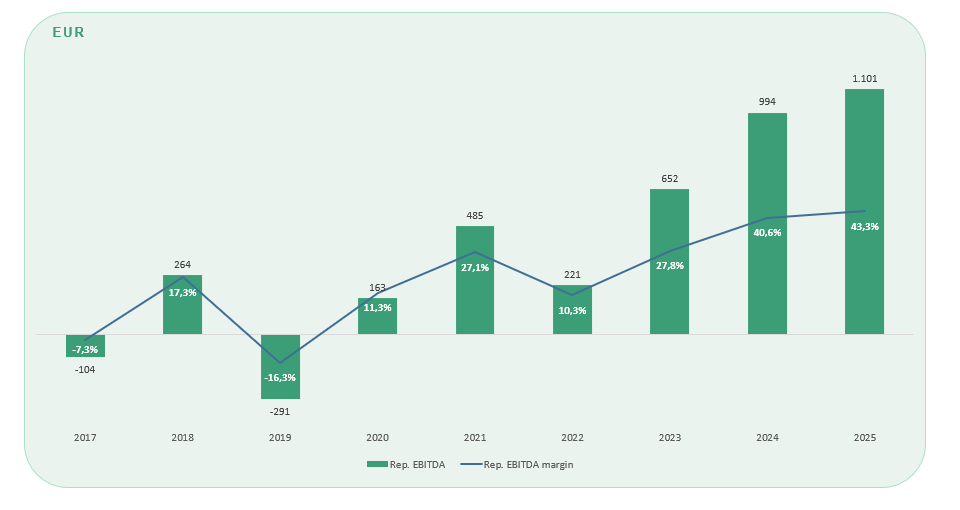
Growing profitability

Reported EBITDA (€ thousand) & margin
Reported EBITDA and EBITDA margin, 2017–2025
Reported EBITDA as a % of product revenue has been on a strong upward trajectory since 2022.

Klappir’s cost structure is simple, with the majority of costs being salaries.
As is customary in tech companies and in accordance with IFRS, Klappir capitalises a portion of salaries as intangible software assets that are later amortised. For information on capitalisation, refer to page 28.
Low customer acquisition costs through the flywheel distribution model, advances in artificial intelligence and its adoption into operations, result in high operating leverage and primes the company for profitable growth.
Financials · 03

CAPEX driven by capitalised R&D costs

Capitalised costs, EURk
3.4002.4001.400400-600-1.600-314560-366649-486636-638767-7441.069-1.0151.584-1.2011.846-1.4012.588-9913.1842462831501293265706441.1872.193201720182019202020212022202320242025
Grants recognised as reduction of R&D costs Capitalised R&D costs Net capitalised R&D costs
Total CAPEX, EURk
06001.2001.8002.4001.8372831731353416216811.1892.193201720182019202020212022202320242025
Net capitalised R&D costs Fixed assets M&A Total CAPEX
Klappir has since 2017 qualified and been awarded a grant from Rannís. The role of the Technology Development Fund is to support development and research in the field of technology aimed at innovation in the Icelandic economy.
While there has been uncertainties surrounding Rannís recently, Klappir’s application for a grant in 2025 has been approved for the amount of 991 mEUR. The grant is recorded in Klappir’s accounts as an offset to the corresponding year’s capitalised R&D costs.
Minimal investments are otherwise required to maintain Klappir’s asset base, they are limited to computers and furniture as the company rents its premises and thus the capital intensity required is low.
Annual accounts 2017–2023 have been amended to align with the 2024 and 2025 accounts after the company took up IFRS. Previously, grants were recognised as other revenue. After IFRS, the grants are recognised as reduction of capitalised R&D costs.
Financials · 04

Guidance

Revenue guidance, EURk
Product revenue
1.7882.1522.3432.4462.5432.74411.002202120222023202420252026E2030E
Rep. EBITDA guidance, EURk
Rep. EBITDARep. EBITDA margin
4852216529941.1015984.80527.1%10.3%27.8%40.6%43.3%21.8%43.7%202120222023202420252026E2030E
CAPEX guidance, EURk
Net capitalised R&D costsFixed assets
3416216811.1892.1931.8542.725202120222023202420252026E2030E
Penetration of new international markets, and the application of the flywheel distribution model are the foundation Klappir expects to build its growth upon. With AI layered on top of the system, customers will find wins easily, increasing retention and ACV for Klappir
With accelerated revenue growth and the high operating leverage enabled by the distribution model and AI advancements, reported EBITDA margin is projected to expand to 43.7% by 2030. Net of capitalisation the EBITDA margin is projected to be 19.1%.
From 2026-2030, investments in business development efforts to realise the growth plan are expected. These costs are often not eligible for capitalisation. Capitalisation as a % of revenue is thus expected lower, reflecting a shift from a building phase to the growth phase. No grants are included in the forecast.
Financials · 05

Balance sheet: 31.12.2025

Assets (EUR ’000)
Intangible assets4.554
Property and equipment324
Security deposit10
Deferred income tax155
Non-current assets5.043
Trade receivables63
Other receivables1.064
Cash and cash equivalents994
Current assets2.121
Total assets7.163
Equity (EUR ’000)
Share capital499
Other restricted shares4.437
Retained earnings(1.651)
Total equity3.285
Liabilities (EUR ’000)
Non-current loans2.404
Liabilities to related parties298
Lease liabilities213
Non-current liabilities2.915
Current maturities of lease liabilities129
Trade payables185
Other payables350
Deferred revenue298
Current liabilities963
Total liabilities3.878
Total equity & liabilities7.163
Convertible bond
  • Klappir maintains a simple capital structure with only one debt instrument outstanding. The €2.4m NEFCO convertible aligns long-term stakeholders with the company’s growth strategy
  • Potential future conversion would deleverage the balance sheet and increase equity capitalisation
Debt to Equity ratio 1.18x
Capital structure
54%
Debt
3.8 mEUR
46%
Equity
3.3 mEUR
Assets
7.2 mEUR
V

Summary

Driving sustainable scale through proven unit economics and trusted data

Summary

Investment highlights

01 · Klappir today
Proven leader solving a critical problem.
  • 10+ years building the leading sustainability data platform
  • Trusted by 800+ organizations in 30+ countries across all industries
  • Enabling organizations to measure, manage and report ESG performance resulting in value adding outcomes
02 · The market
Market tailwinds and competitive advantage.
  • Regulations, stakeholder demands and rising costs are driving urgent need for data and transparency
  • Deep expertise, data infrastructure and customer relationships secure Klappir's leadership
03 · The future of Klappir
AI-powered platform and global expansion.
  • Embedding AI (Embla) to automate data collection, enhance insights and drive actionable outcomes in 99% less time compared to pre-AI
  • Scaling internationally with strong momentum in key markets
04 · Financials
Strong financial profile and clear outlook.
  • Recurring-revenue model with strong growth potential through the flywheel model, high retention and proven scalability
  • High operating leverage enables profitability growth as recurring revenues scale
Organisation

Built for PLG & Partner-led distribution and service

Board
Compliance officer
CEO
Corporate functions
FinanceLegal & ComplianceInvestor relationsInternal digital systemsExternal growth like M&A
Business development
Business developmentPartner networkEcosystemInternational ExpansionMarketing
Customer Success
Customer SuccessOnboardingAcademyKnowledge base
Product & Innovation
EngineeringAI and AutomationProduct ManagementData and ecosystemProduct roadmapProduct marketing

A scalable organisation built for partner-led expansion, rapid onboarding, and unified product innovation.

Customer Value fully integrated under Ecosystem & Growth aligns delivery, adoption, and expansion into one unified growth engine.
Stronger partner-led scalability because partners and CS teams collaborate under the same leadership.
Better customer lifecycle management: onboarding → success → engagement → expansion all sit in one unit.
Aligned research and product development
Strong feedback loop from ecosystem for product development

Disclaimer

This presentation has been prepared by Fossar Investment Bank (“Fossar” or “the Advisor”) in connection with a potential capital raise as publicly disclosed by Klappir Green Solutions hf. (“the Company”). This presentation is strictly confidential and is provided to the recipient solely for their private information and not for general or further distribution.

The contents of this presentation do not constitute investment research, investment advice, offer or a recommendation to buy or sell any specific financial instruments under Act no. 115/2021. Recipients are solely responsible for any investment decisions made based on the information presented herein and are strongly encouraged to seek independent professional advice prior to making such decisions. Trading in financial instruments can be risky and past performance is not a guarantee or a reliable indicator of future results.

The presentation has been prepared based on limited information made available to the Advisor. The Advisor relies on information obtained from sources believed to be reliable but does not guarantee its accuracy or completeness. The information contained herein has not been independently verified by the Advisor and may be subject to change or revision, which could materially affect the content of this document. The Advisor shall not be liable for any loss that may be attributed to any information proving to be inaccurate, unreliable or inadequate. The Advisor is not obliged to make amendments or changes to this presentation should errors be discovered or opinions or information change.

Neither the Advisor nor any other person makes any representation or warranty, express or implied, as to the accuracy, reliability, completeness, or fairness of the information or opinions contained herein. Accordingly, neither the Advisor nor any officer, employee or shareholder thereof accepts any liability whatsoever, whether direct or indirect, for any loss or damage of any kind arising from the use of, or reliance on, the information contained in this presentation.

The Advisor makes no assurance or guarantee that any forecasts, projections, or intentions described herein will be achieved. Any statements regarding anticipated or expected future performance, forecasts, or intentions are subject to risks and uncertainties which may result in materially different outcomes. Recipients are therefore cautioned not to place undue reliance on such forward-looking statements or intentions, which should not be regarded as promises or assurances of future results or performance, including but not limited to profitability.